- Copied
Checking grades
Can't find what you're looking for? Search Resources
Grade history
Schools can use the Grade History Function in Schools Online or the Results Analysis Package to view the grades they have allocated in each course.
Schools can monitor their grade patterns by comparing them to other available data about the performance of students at their school. This will enable schools to have confidence that the grades they intend to allocate are consistent with what they expected from a particular cohort or group of students completing a course.
Comparing grading patterns
After a school has entered A to E grades for a course, the Grade History function in Schools Online and in the Results Analysis Package can be used to compare this pattern of grades to the pattern of grades allocated in similar courses over time.
For example, a school can look at the pattern of grades allocated for Year 11 Biology and compare it to the pattern of grades allocated in Year 10 Science over time. In doing this, schools should take into account the number of students undertaking each course, the differences between the courses, and the quality of the candidature.

If a school’s Stage 5 cohort for Science had the pattern of grades illustrated in the graph but the pattern of grades for Year 11 Biology the following year was markedly different, the school could consider possible reasons for this.
Considering past HSC performance
Schools can view the pattern of past HSC performance of student from their school for a particular course to assist in confirming the Year 11 course grades. The Band History function in Schools Online and in the Results Analysis Package enables schools to view their history of HSC performance band results in graphical format, similar to the way grade histories are displayed.

Note that there is no direct correlation between HSC performance bands and Year 11 grades. However, general patterns over time provide information about the performance of students at the school, which could be used to help confirm that the proposed pattern of grades for the Year 11 course looks reasonable.
Comparing results for specific student groups
A function called Work with Student Groups is available in the Results Analysis Package to enable schools to place selected students in groups based on their own criteria. Schools can then use the Grade Analysis function to view past grades for the groups they have created.
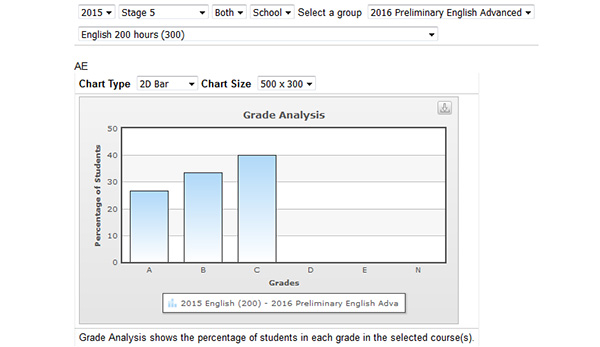
For example, a teacher of Year 11 English Advanced may want to create a group containing the students from their Year 11 class and use the Grade Analysis function to view the grades that this group of students was allocated for English in Year 10. As this function allows a graph of only the grades allocated to the selected students to be displayed, it may be more useful than a comparison to grades for the whole Year 10 cohort. It also enables schools to view the grades allocated to their current Year 11 students who completed Year 10 at other schools.
The following graph shows the pattern of Year 10 English grades allocated to a group of students studying the Year 11 English Advanced course.
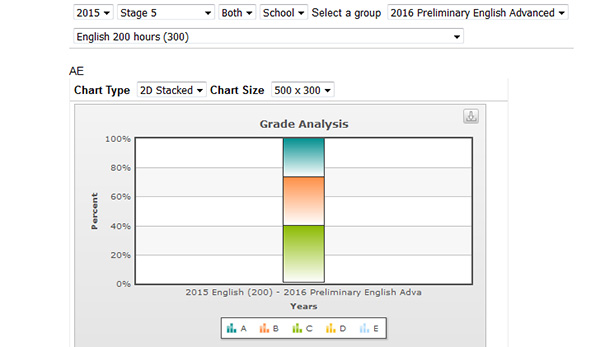
The same data can be displayed in a 2D stacked graph, which can more easily be compared to the graph that appears in Schools Online when grades are entered.
For further information on using the Work with Student Groups function, refer to the PowerPoint in Schools Online.
